Building a scalable web application with ASP.NET Core and Azure - part 3

In this series of blog posts, we are going to build a scalable web application that can handle millions of users with Azure and .NET. In part 3, we’re going to measure our initial implementation and look for bottlenecks.
Measuring scalability
Now that we have a solution for our problem, how can we know if it’s good enough? First, we need to define what “good enough” means in our context. Luckily, we already did that in the first post: We want to be able to handle 11k requests/second.
How do we know if our system can do that? The answer is simple and complex at the same time: We need to try it out. There’s no real way of knowing unless we actually see our application handle the required load. If your user base grows organically over time, you might be able to extrapolate from the current numbers. But in a distributed application, there are many moving parts, so you still might experience problems you didn’t see coming.
In cases like sales or - in our case - events that take place at a fixed date and where there are going to be huge spikes in the number of concurrent users, the only way is to simulate the expected load and see how well our application handles it.
This will not only tell us if there are any bottlenecks in our architecture, but also where they are. As with all performance problems, it’s important to measure and analyze before we start to optimize.
Fortunately we are not the first to meet these challenges, and there are lots of different tools available to simulate load for our application. In this series, we’re going to use the relatively new Azure Load Testing. It uses the most popular open-source load testing tool Apache JMeter behind the scenes, which has multiple advantages:
- It offers many features available in JMeter, including an ecosystem of plugins.
- It’s fully managed - no need to provision servers or install anything ourselves. We can even split the load to be generated from different data centers, which can be useful if our app is deployed in different regions as well.
- Because it’s running in Azure, it is possible to contrast the client-side metrics captured by JMeter (e.g. response times) with server-side metrics (e.g. CPU load) directly.
Azure Load Testing
In a nutshell, a load test works by simulating a certain number of virtual users. Each user runs a predefined workflow by executing one or more requests. When a user finishes his workflow, he starts again from the beginning. We need to define the test plan (the workflow) and the load pattern (how many virtual users do we want to simulate over time).
Test plan
The test plan defines the workflow the virtual users are going to simulate. We can use variables to provide dynamic values (so that different users use different ids, for example), or we can capture values from the responses of previous requests. For simple use cases, we can configure the requests direcly through the Azure portal user interface:
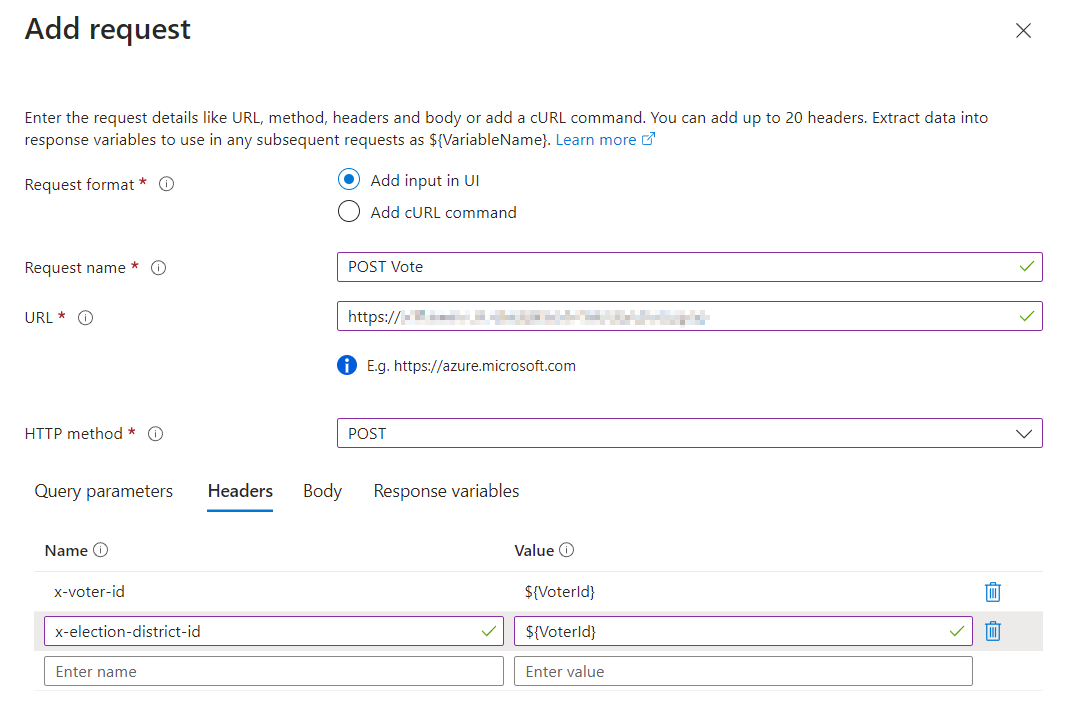
Defining a request through the Azure portal UI
For more advanced scenarios, we can use JMeter scripts to define the workflow.
Scalection workflow
As described in part 1, the workflow we want our virtual users to run consists of two requests:
- A GET request to retrieve the parties and candidates for an election
- A POST request to store the vote
For the post request, we need to include the voter’s voter-id and election-district-id as HTTP headers. Because of that, we need to parameterize these requests, so that each virtual user will send different values. We can upload a CSV file containing the id pairs for the millions of voters in our database, and each time a virtual user runs the workflow, it will use a unique row from that file to replace the parameters. So in our case, as virtual users start again from the beginning when they are finished, each virtual user actually simulates different voters over time.
We ended up converting our test to a JMeter script because our CSV file with the parameters got to big and needed to be compressed, which is not supported in the simple, portal-based version. Azure can do this conversion automatically though. The files are available on GitHub, if you want to check them out.
Load pattern
The load pattern defines how long we want to run the test and how many concurrent virtual users we want to simulate. Usually you don’t start with the full load, but start with a low number of users and add more and more over time (“ramp up”). This is useful when auto-scaling is active, in order to give your application time to react. If things start to break at some point, you also know at which number of users that happened instead of just that it were too many.
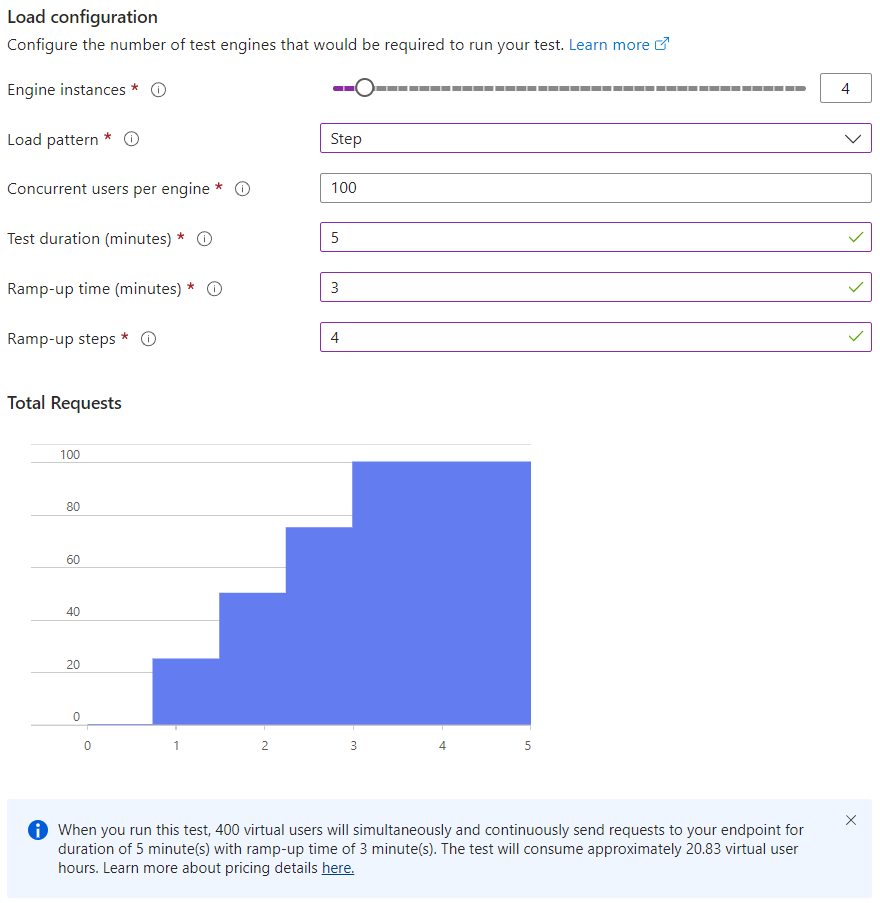
Configuring the load pattern through the Azure portal UI
You’ll notice the number of virtual users is determined by two parameters: Engine instances and Concurrent users per engine. In order to simulate large numbers of users, Azure needs to use multiple instances of the load test engine. What we configure here is the load pattern for one such engine, and you can vary the number of engines you want to for a test run.
We set the number of users per engine to 100, mainly to make it simple to set a given number of users for a test run. We used 4 engine instances (400 virtual users) and we ran our tests for 5 minutes with a ramp up time of 3 minutes using 4 steps, but this setup really depends on your use case. If you care not only about scalability, but also about elasticity (being able to handle spikes in the number of users without prior knowledge), you can also test for that.
Virtual Users vs. Requests per Second
Wait a minute, how can we test if our app can handle more than 10,000 requests per second with only 400 virtual users? Well, in order to achieve numbers like that, we need response times much less than 1 second for each request. As mentioned above, each virtual user is just going to start a new workflow and simulate another voter after finishing, so (hopefully) we will have much more than just 400 requests.
But how do we know how many virtual users we need? This is what the documentation recommends:
To simulate a specific number of RPS with a load test, given the application’s latency, you can then calculate the required number of virtual users.
The formula is: Virtual users = (RPS) * (latency in seconds).
For example, given an application latency of 20 milliseconds (0.02 seconds), to simulate 100,000 RPS, you should configure the load test with 2,000 virtual users (100,000 * 0.02).
There’s a problem with this approach, however: We don’t know the latency of our requests. Even worse, the latency is not a constant value. The more concurrent requests there are, the longer any single request can take.
We found this a little unintuitive when we first started working with load tests. After experimenting with different values, it turned out that using more than 400 virtual users didn’t increase the number of requests in our scenario. Consider these two test runs, for example:
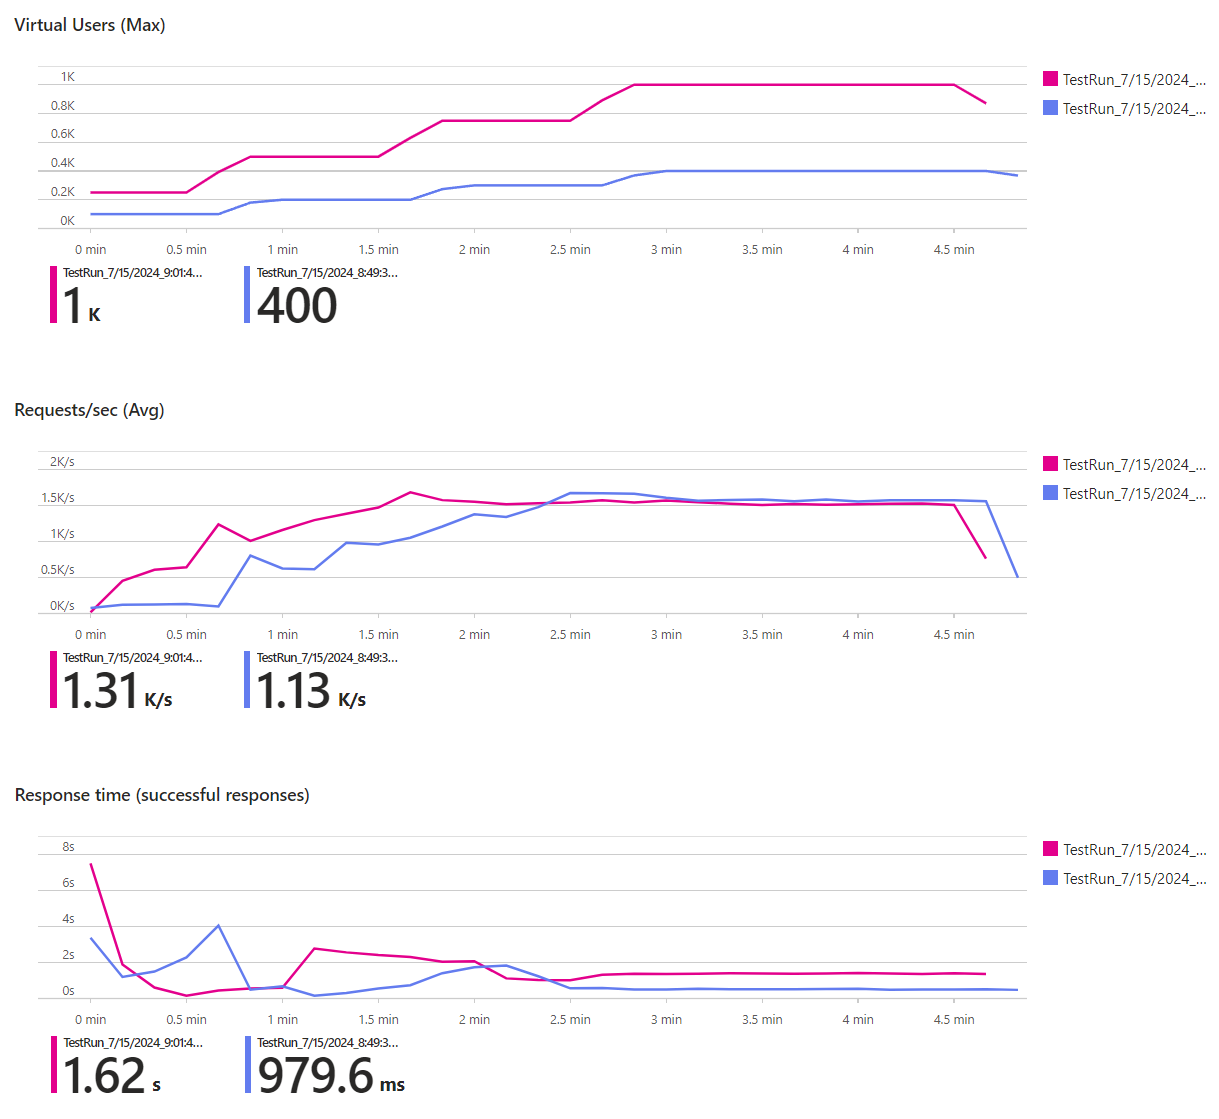
The charts compare the number of virtual users, the requests per second (RPS) and the response time of two test runs, purple representing 4 engine instances/400 users and pink 10 engine instances/1,000 users (the results are filtered to the POST Vote endpoint here). During the ramp-up phase, the test with more engines (pink) achieved more RPS. As more users became active, the response times increased proportionally though. So while our system could handle more users, the RPS didn’t increase. No matter if we had 400 or 1000 virtual users, the RPS converged to about 1.6k. This leads us to the next topic.
Analyzing the results
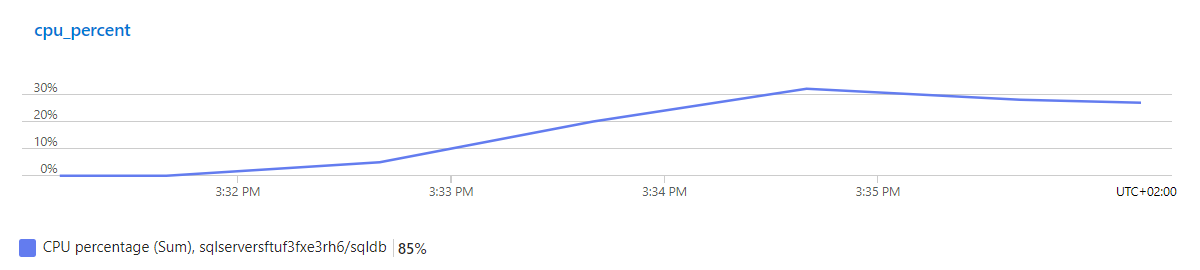
As the number of users increases, we seem to hit a bottleneck. Let’s see if we can identify it. As mentioned above, a nice advantage of using Azure Load Testing is that we can link existing Azure resources to the load test (our database, for example) and look at server side metrics as well:
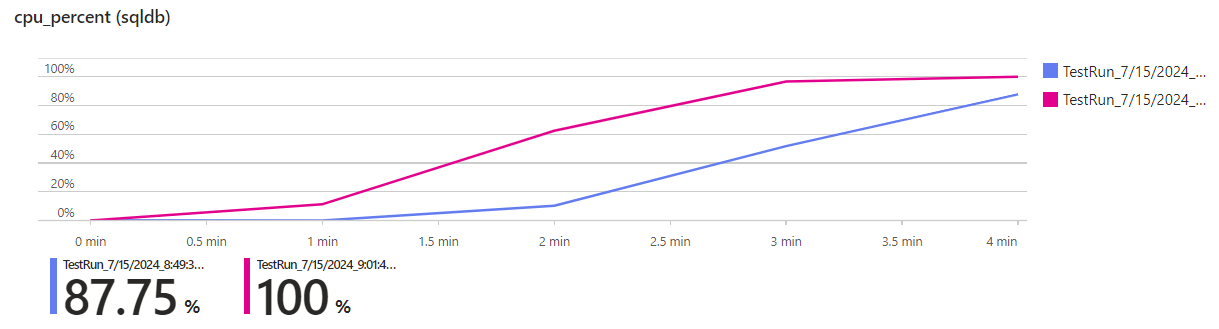
In the test run with 10 instances (pink), the CPU load of the database peaks at 100%, that’s why we cannot handle any more requests.
Another interesting insight is that while the response time does increase, there are no failed requests. This is because both requests in our workflow only contain simple SQL statements (e.g., primary key-based lookups and updates), which the database can complete quickly. In other words: it’s very hard to make these simple statements take so long that they result in a timeout (30 seconds by default). If we had more complex queries joining multiple tables together, timeouts could occur. In our case, the requests just “queue up” at the web servers (remember: we set up our Azure Container App so that it can scale out to 10 instances), but once a database operation is started, it will finish quickly.
We can confirm this by limiting the Container App to one instance and running another test:
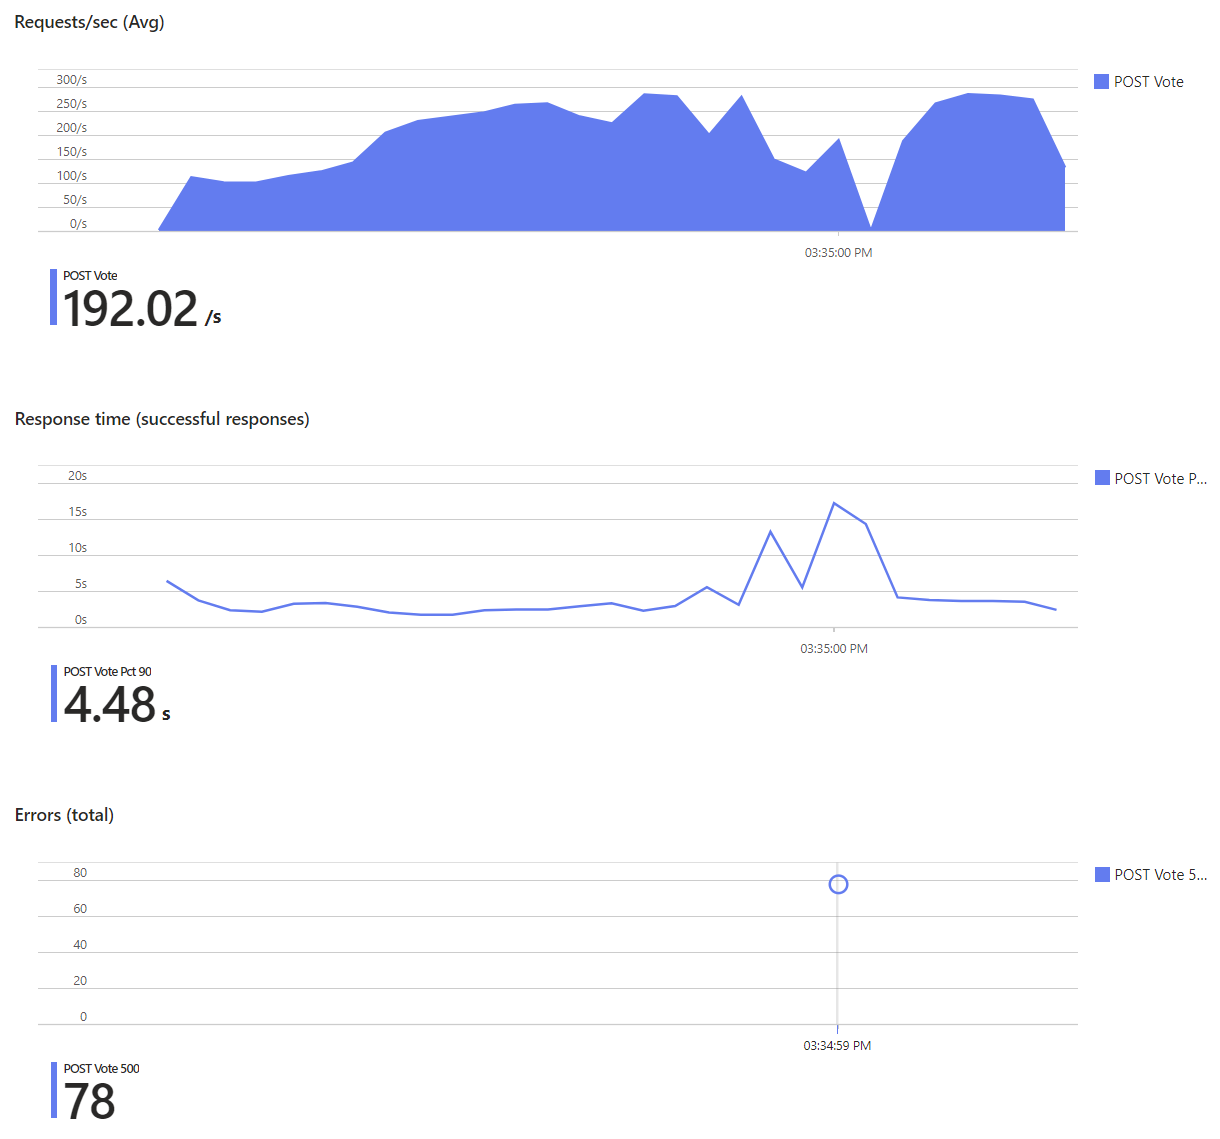
As you can see, this time the response times get longer and longer until requests really start to fail, even though the database’s CPU usage doesn’t exceed 30%:
One instance of the app server isn’t enough to handle the number of requests in our load test, but the automatic scale out works great. With multiple instances, the database becomes the new bottleneck, but the app instances are able to buffer our number of requests (and more), so no actual errors occur, only the response time increases. On the one hand, that’s good news, but on the other hand, it doesn’t really help us reach our scalability goal.
Let’s look at the total number of requests, including the GET Parties requests this time. The metrics look very similar - they have to, since the execution of the two requests is coupled by our workflow: each virtual user alternately sends GET and POST requests. There are about 1.65k RPS for each of those requests, so in total we can currently handle about 3.3k RPS:
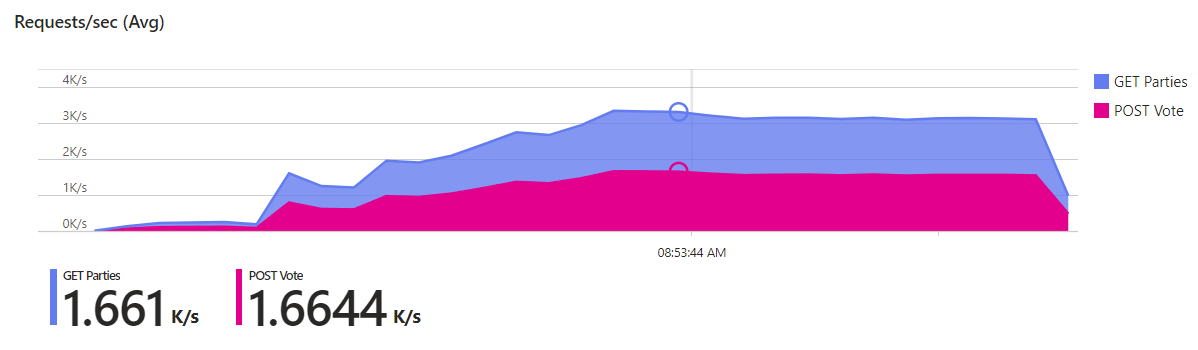
That’s less than one third of our goal of 11k RPS. Cleary, we need to handle more requests per second, and our main bottleneck at the moment is the database.
Improving our solution
Different possibilities how we could increase the throughput come to mind:
-
Improve the code: There’s still room for improvement in our code. We could replace
SingleAsyncwithAnyAsync(we don’t need the result) for some validation checks. We could use Entity Framework features like No-Tracking, replace it with more lightweight libraries like Dapper or even use hand-written queries or stored procedures. These are all micro-optimizations though, they might help squeezing the last bit of performance out of the code, but they might (arguably) come at a price of reduced productivity and maintainability and, more importantly, they won’t solve our scalability problem. For now, there are lower hanging fruits. -
Scale up the database: We’re using a cloud-based database (a Standard-series (Gen5) with 2 vCores was used in the tests). Using a more powerful version is literally as simple as moving a slider to the right. However, this can quickly become expensive: The cost of 1 vCore is currently 195.21 USD/month. Up to 128 vCores are possible (which would cost 25,000 USD/month). Using a serverless option that automatically scales up and down based on the current load could help reduce the bill if you don’t need the power the whole time. For our Scalection app, it could be a viable option to scale up just for the election day.
Scaling up the database also immediately improves the performance, so it can buy you some time when you’re already experiencing problems and need to figure out the bottlenecks and improve your code or architecture. -
Reduce the load on the database:
The fastest code is code that doesn’t run. Half of our requests repeatedly retrieve data from the database that doesn’t change at all (parties and candidates). ThePOST Voterequests also need to load the data in order to validate the vote. We can get rid of most of our database calls simply by caching the results. This should dramatically reduce the load on the database, and it can be accomplished with very few changes to the code.
Summary
In this post, we introduced Azure Load Testing and used it to measure the performance of our initial implementation. We analyzed the results and found out the we currently support a little more than 3,000 requests per second. The database is the current bottleneck.
We looked at different solutions to solve the problem, and identified caching as the most promising one. In the next post, we’ll implement it and test how much it improves the scalability of our app.